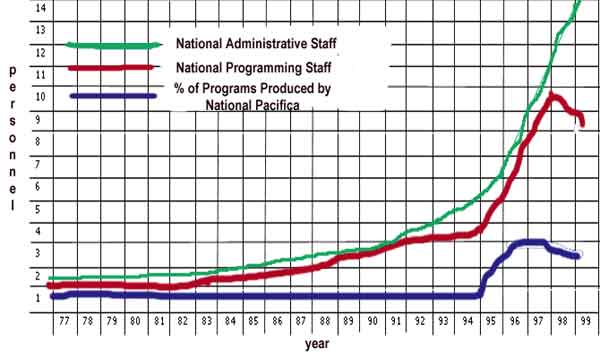
Graph Showing Relative Growth of National
Administrative Staff, National Programming Staff and Number of National
Programs Produced
1977-1999
Sitekeeper's Note: The graph below should be understood as a visual representation, as opposed to a mathematically precise plot. The original chart was hand drawn, and the data from which it was extrapolated was not available.